Spatial Digital Twin for NSW
A spatial digital twin for NSW utilising open data sources and highlighting correlations between data sets.
About
This spatial digital twin for NSW is an application that synthetises data from multiple sources (APIs and CSV files) and helps users find correlations between them and uncover interesting patterns.
Datasources
The currently supported data sources are:
| Name | Type | Reference |
|---|---|---|
| Air Quality | API | dpie.nsw.gov.au |
| Traffic volume | API | transport.nsw.gov.au |
| Traffic incidents | API | opendata.transport.nsw.gov.au |
| Weather | API | bom.gov.au |
| Greenhouse gas emissions | CSV | data.cityofsydney.nsw.gov.au |
| Crime | CSV | bocsar.nsw.gov.au |
Architecture
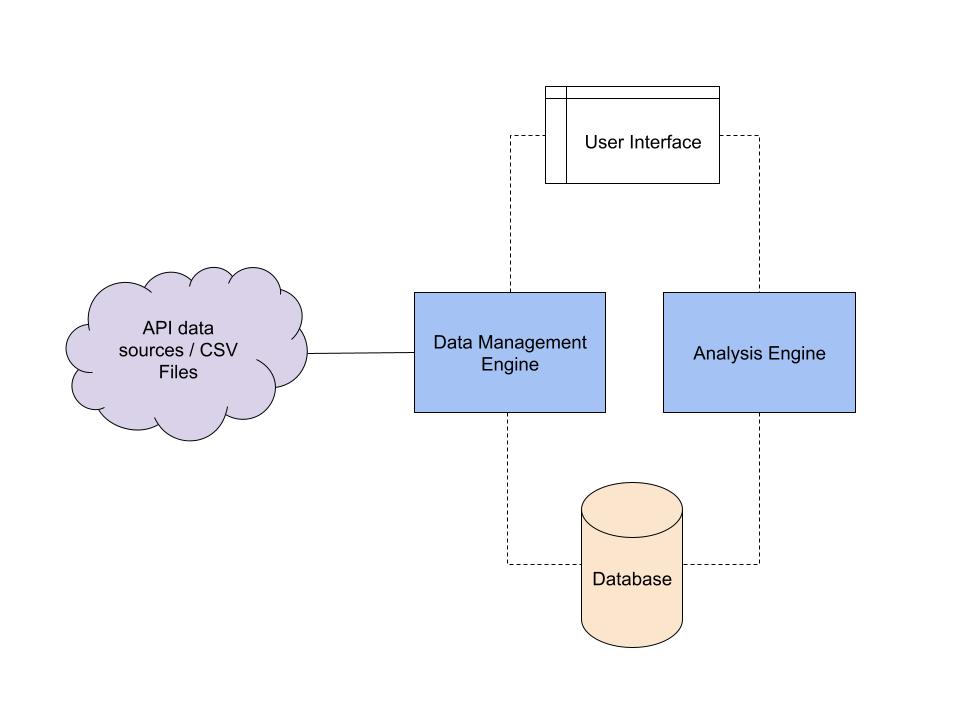
There are 4 main components to the application. They are the
- Data Management Engine - responsible for fetching and updating the database.
- Analysis Engine - processes data and returns signficant correlations for given data sources.
- Viewer - user interface to make selections and view results.
- Database - continually stores new data and is updated through the Data Management Engine.
Server
This section outlines the backend of the application, made up of the data management engine, the analysis engine and the database.
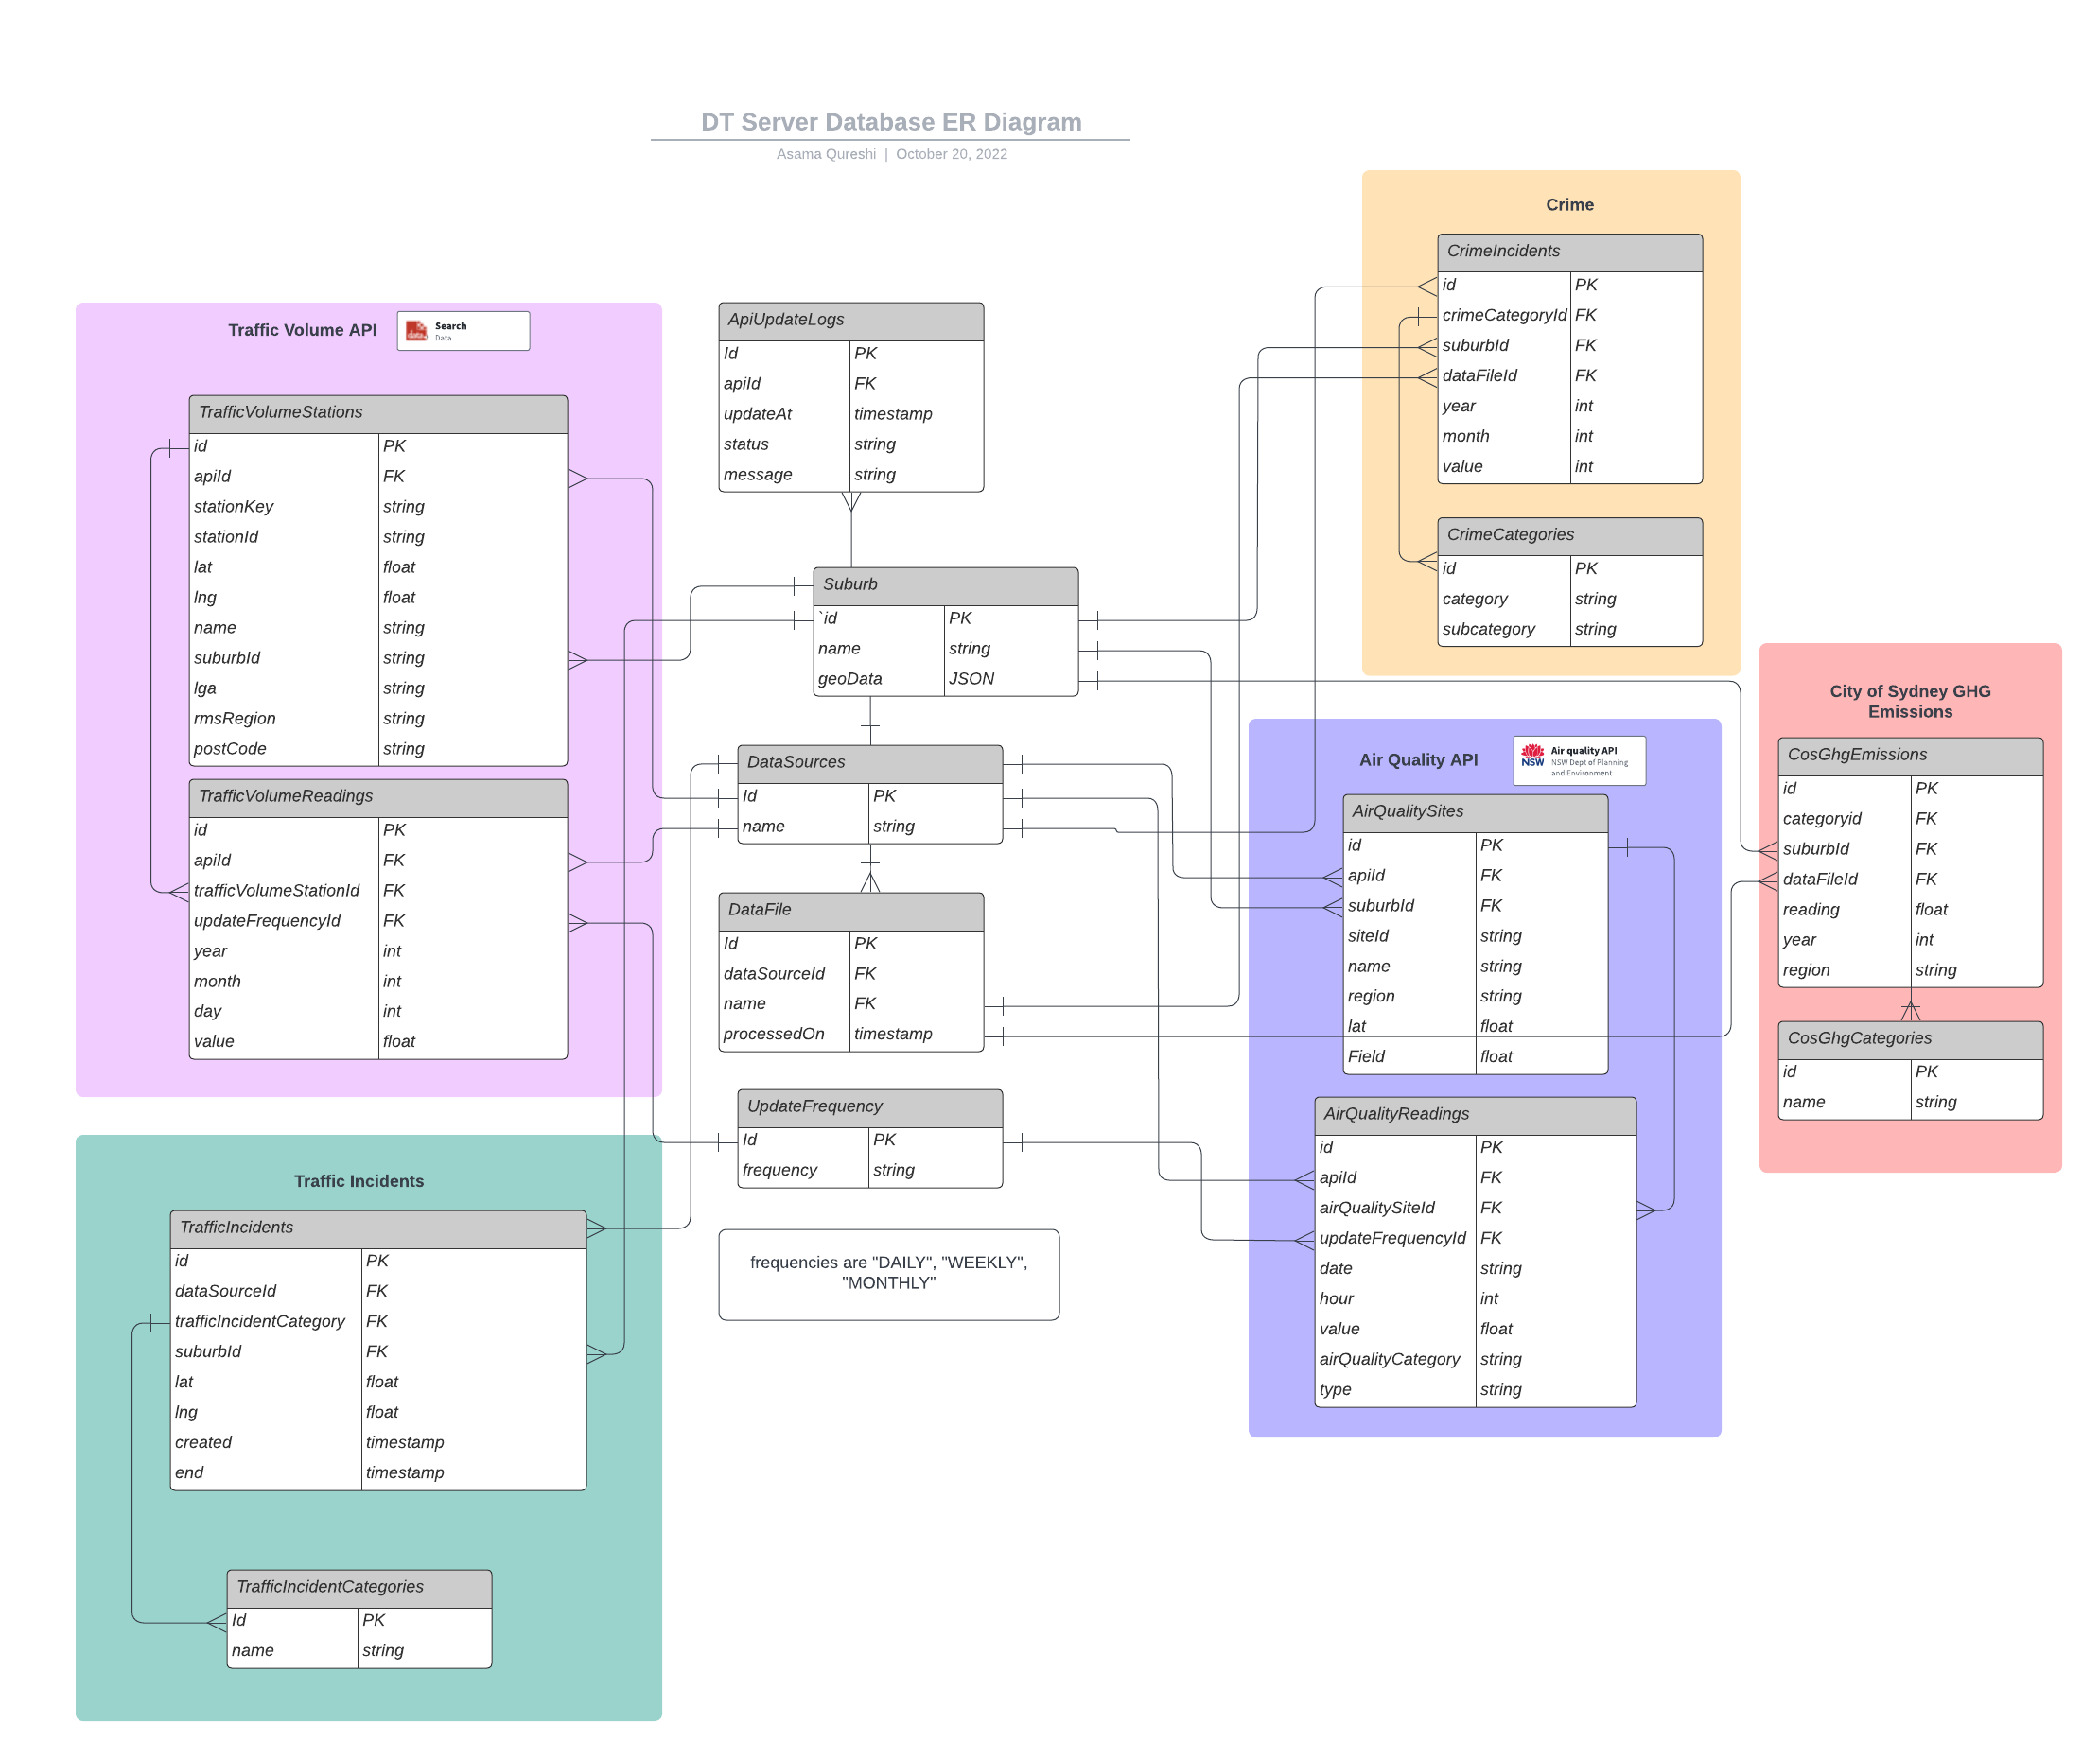
ER Diagram
Data Management Engine
The Data Management Engine is responsible for retrieving the data from the given sources and updating it to the database. It is also responsible for fetching data for analysis and visualisation purposes.
The application connects to all of the APIs mentioned in "Datasources" and updates retrieved data from them daily. For CSV files, it uploads them once. It can upload a CSV files with new, additional data, if it is given under a different name, and it will not reupload rows which were already uploaded.
Analysis Engine
The Analysis Engine parses data using a number of available techniques to gain insights.
Currently supported techniques include:
- Simple Correlation - This method takes two data sources and compares them, returning a value representing their correlation and a score, to identify of how much significance this result is.
Viewer
This frontend combines the result from the Data Management Engine and the Analysis Engine and allows a user to select data sources of interest, and view results for them.
Comparison View
This view allows a user to compare 2 data sources and view the results for them for a spatial area and time period, and finds correlations for subtypes of the data for the same selection.
The viewer supports data sources that are fixed locations (points) or regions (polygons). Fixed locations are represented as coloured dots and regions are represented with grey polygons.
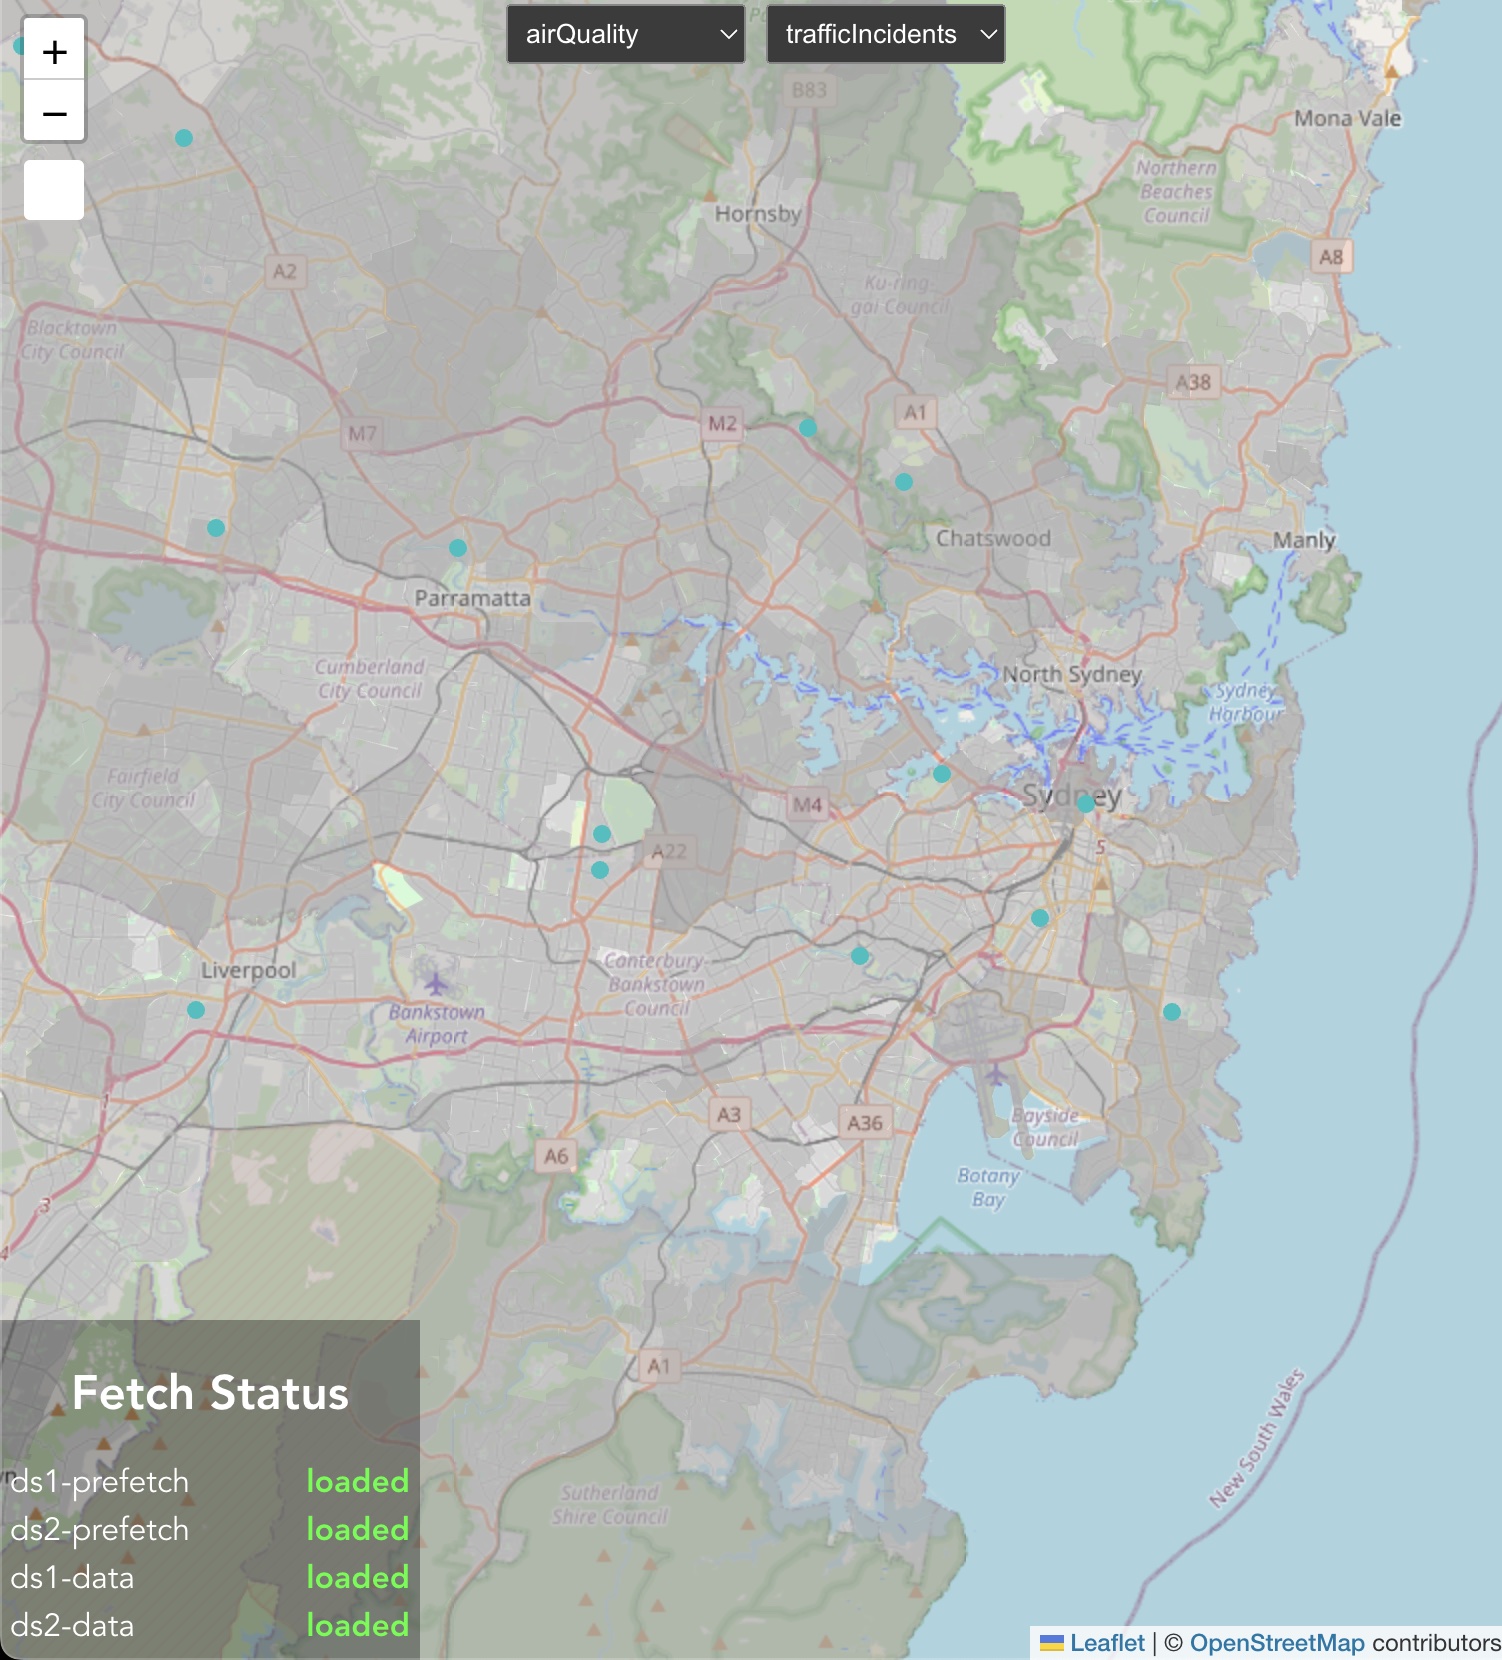
To select data, draw a rectangle by clicking the white button in the top left corner and click on two points to create a rectangle over that region. Selected points and polygons will become highlighted and data will be retrieved for that region.
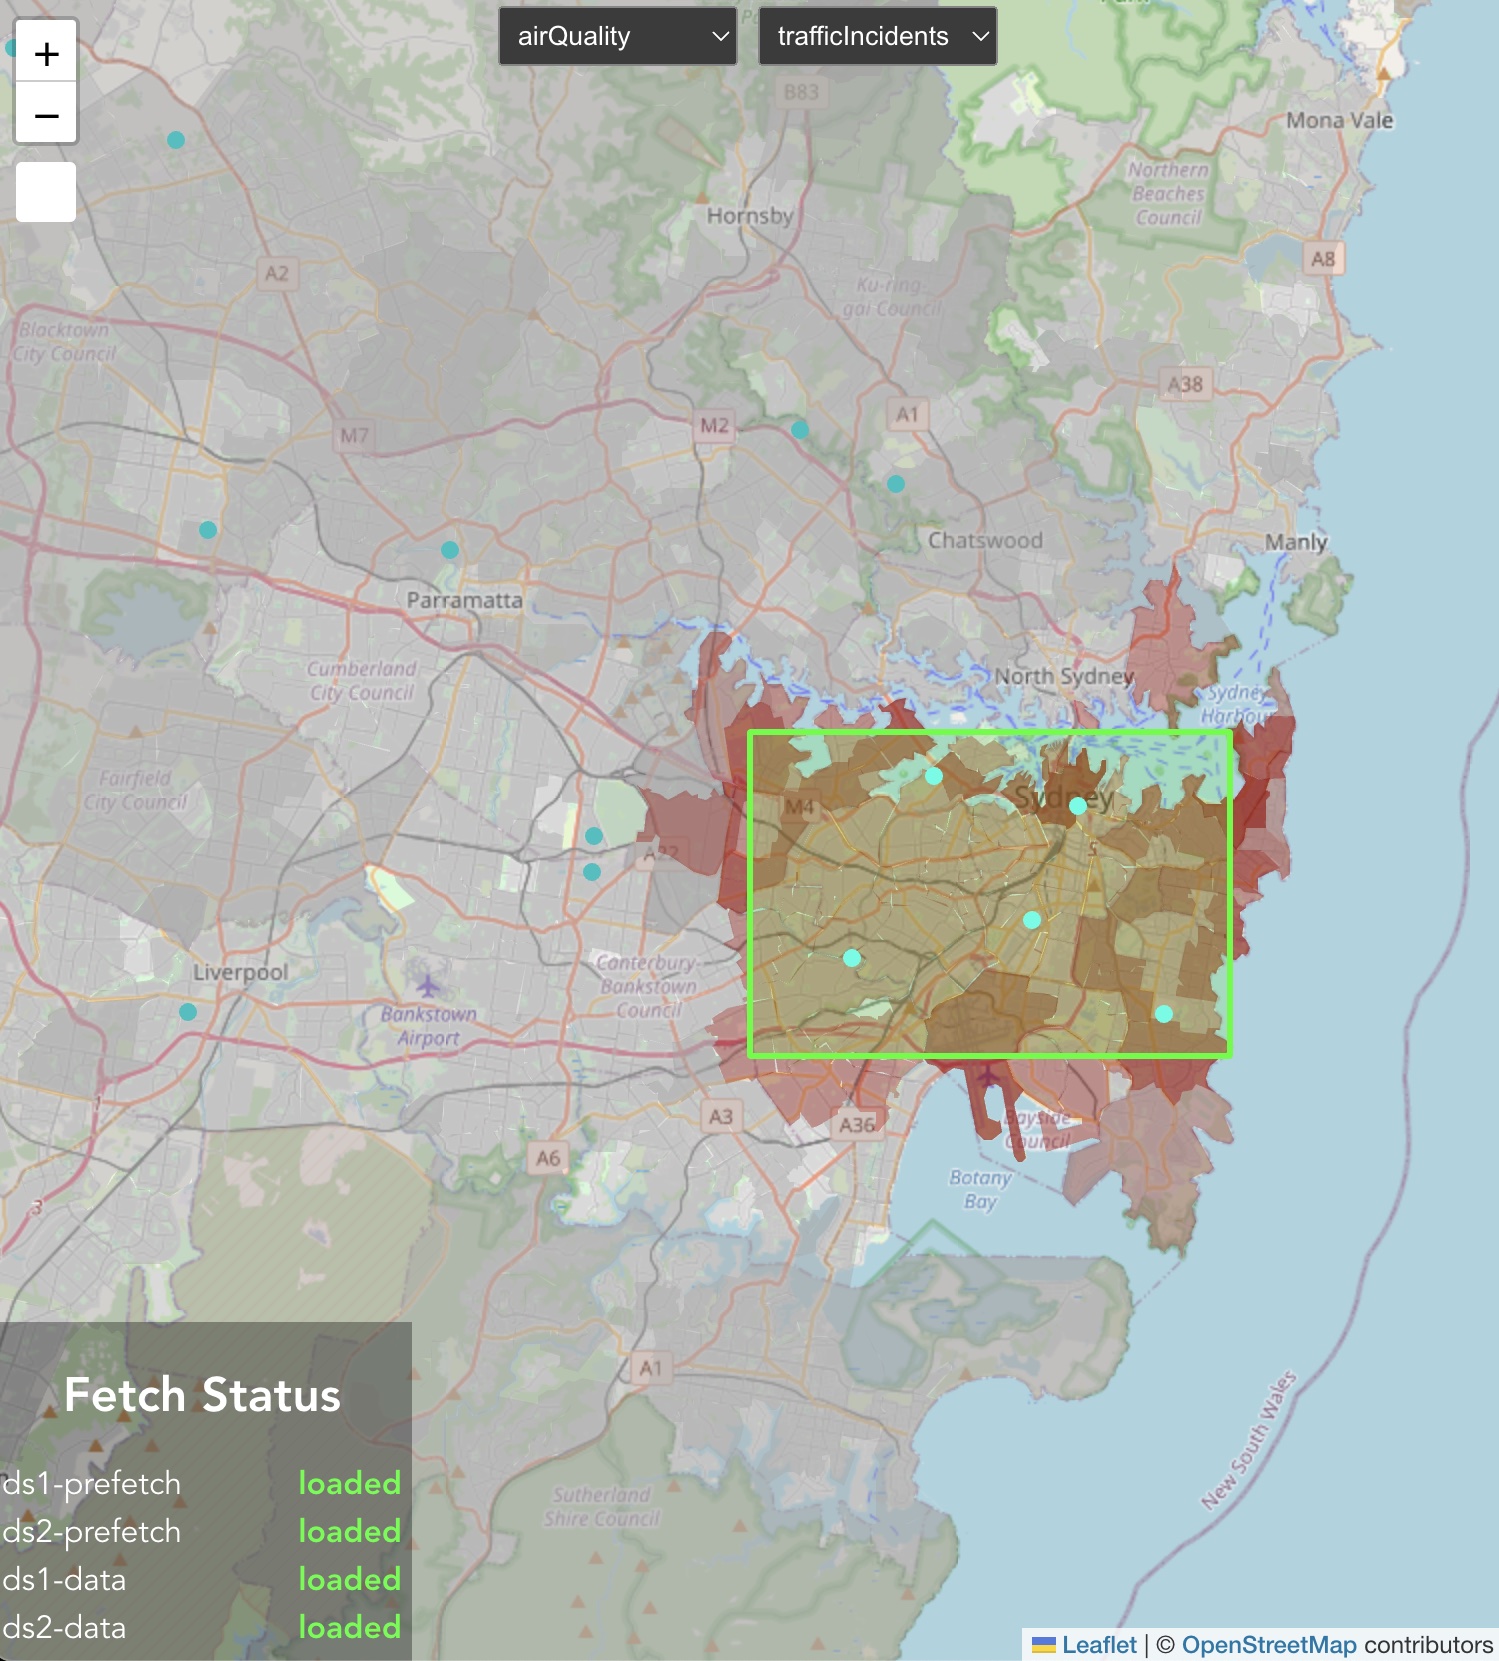
On the right hand side, initial data will be displayed. We can adjust the date range for which data is fetched using the sliders, and change the aggregation of the data to be daily, monthly or yearly.
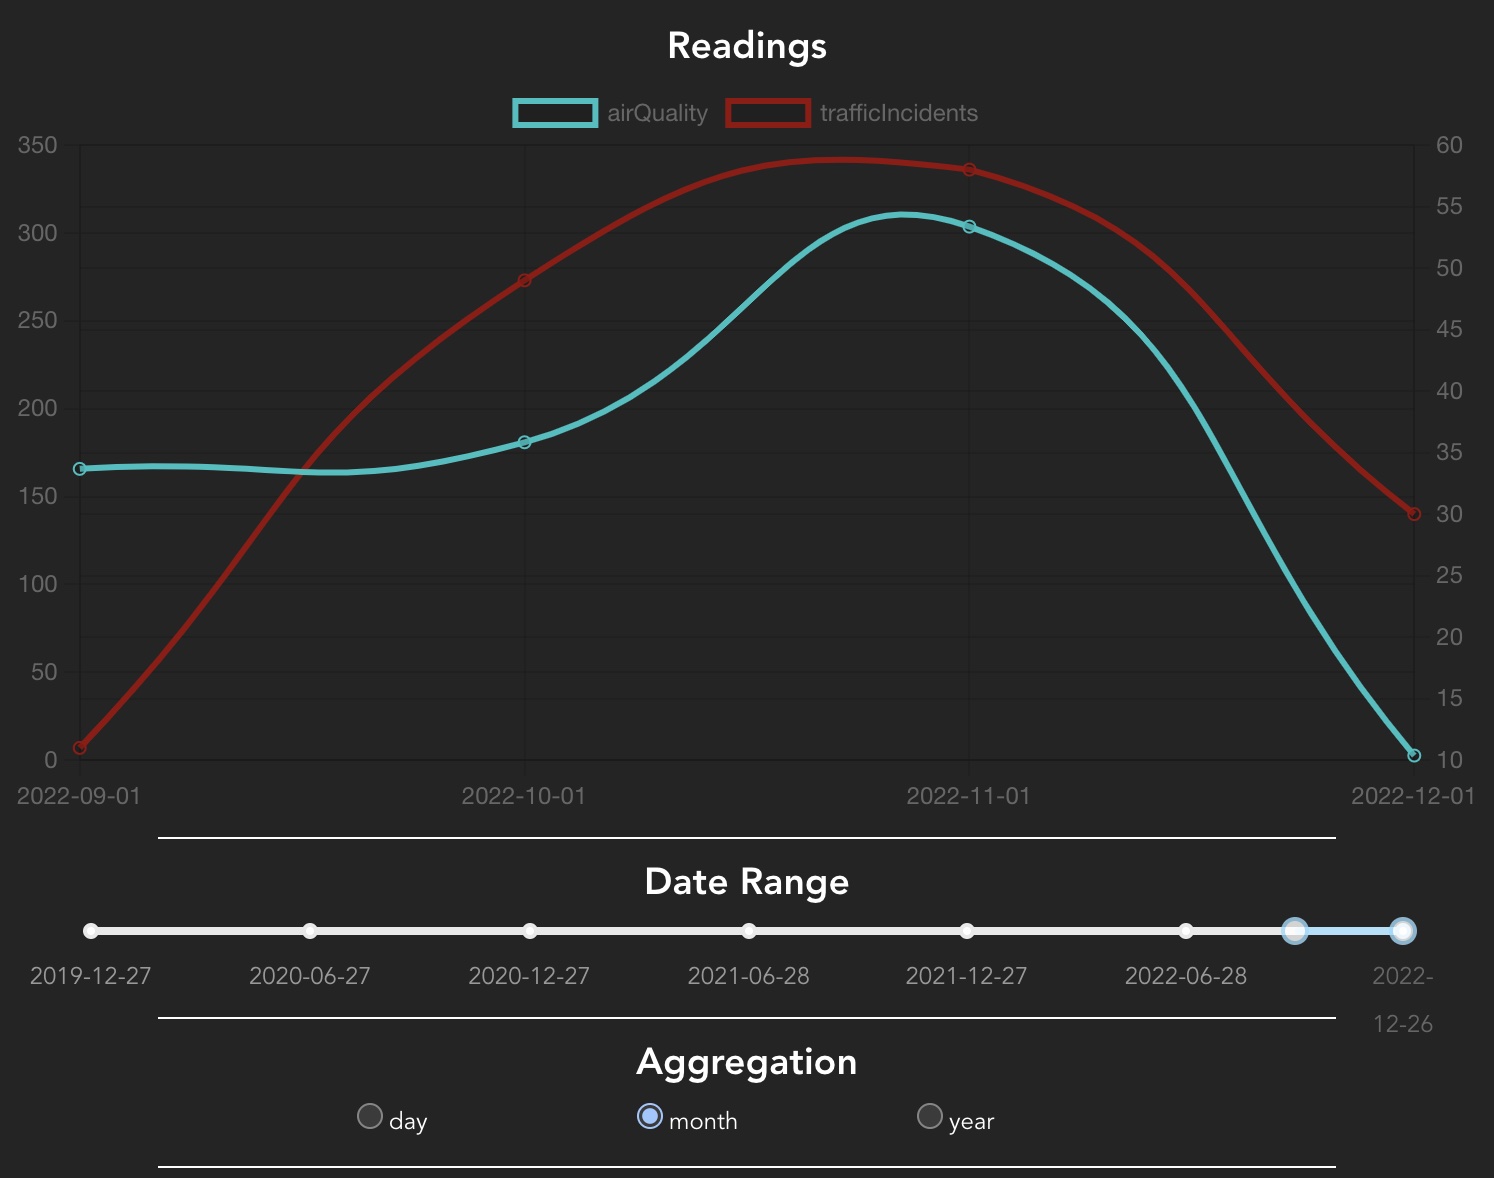
At the bottom of the right hand pane, we can choose what attributes of the data to filter by.

Having made a selection for the date range and aggregation, we can retrieve the most significant correlations using the "Get correlations" button. After reviewing the correlations, we can filter by attributes to view the data that the correlations were returned for.


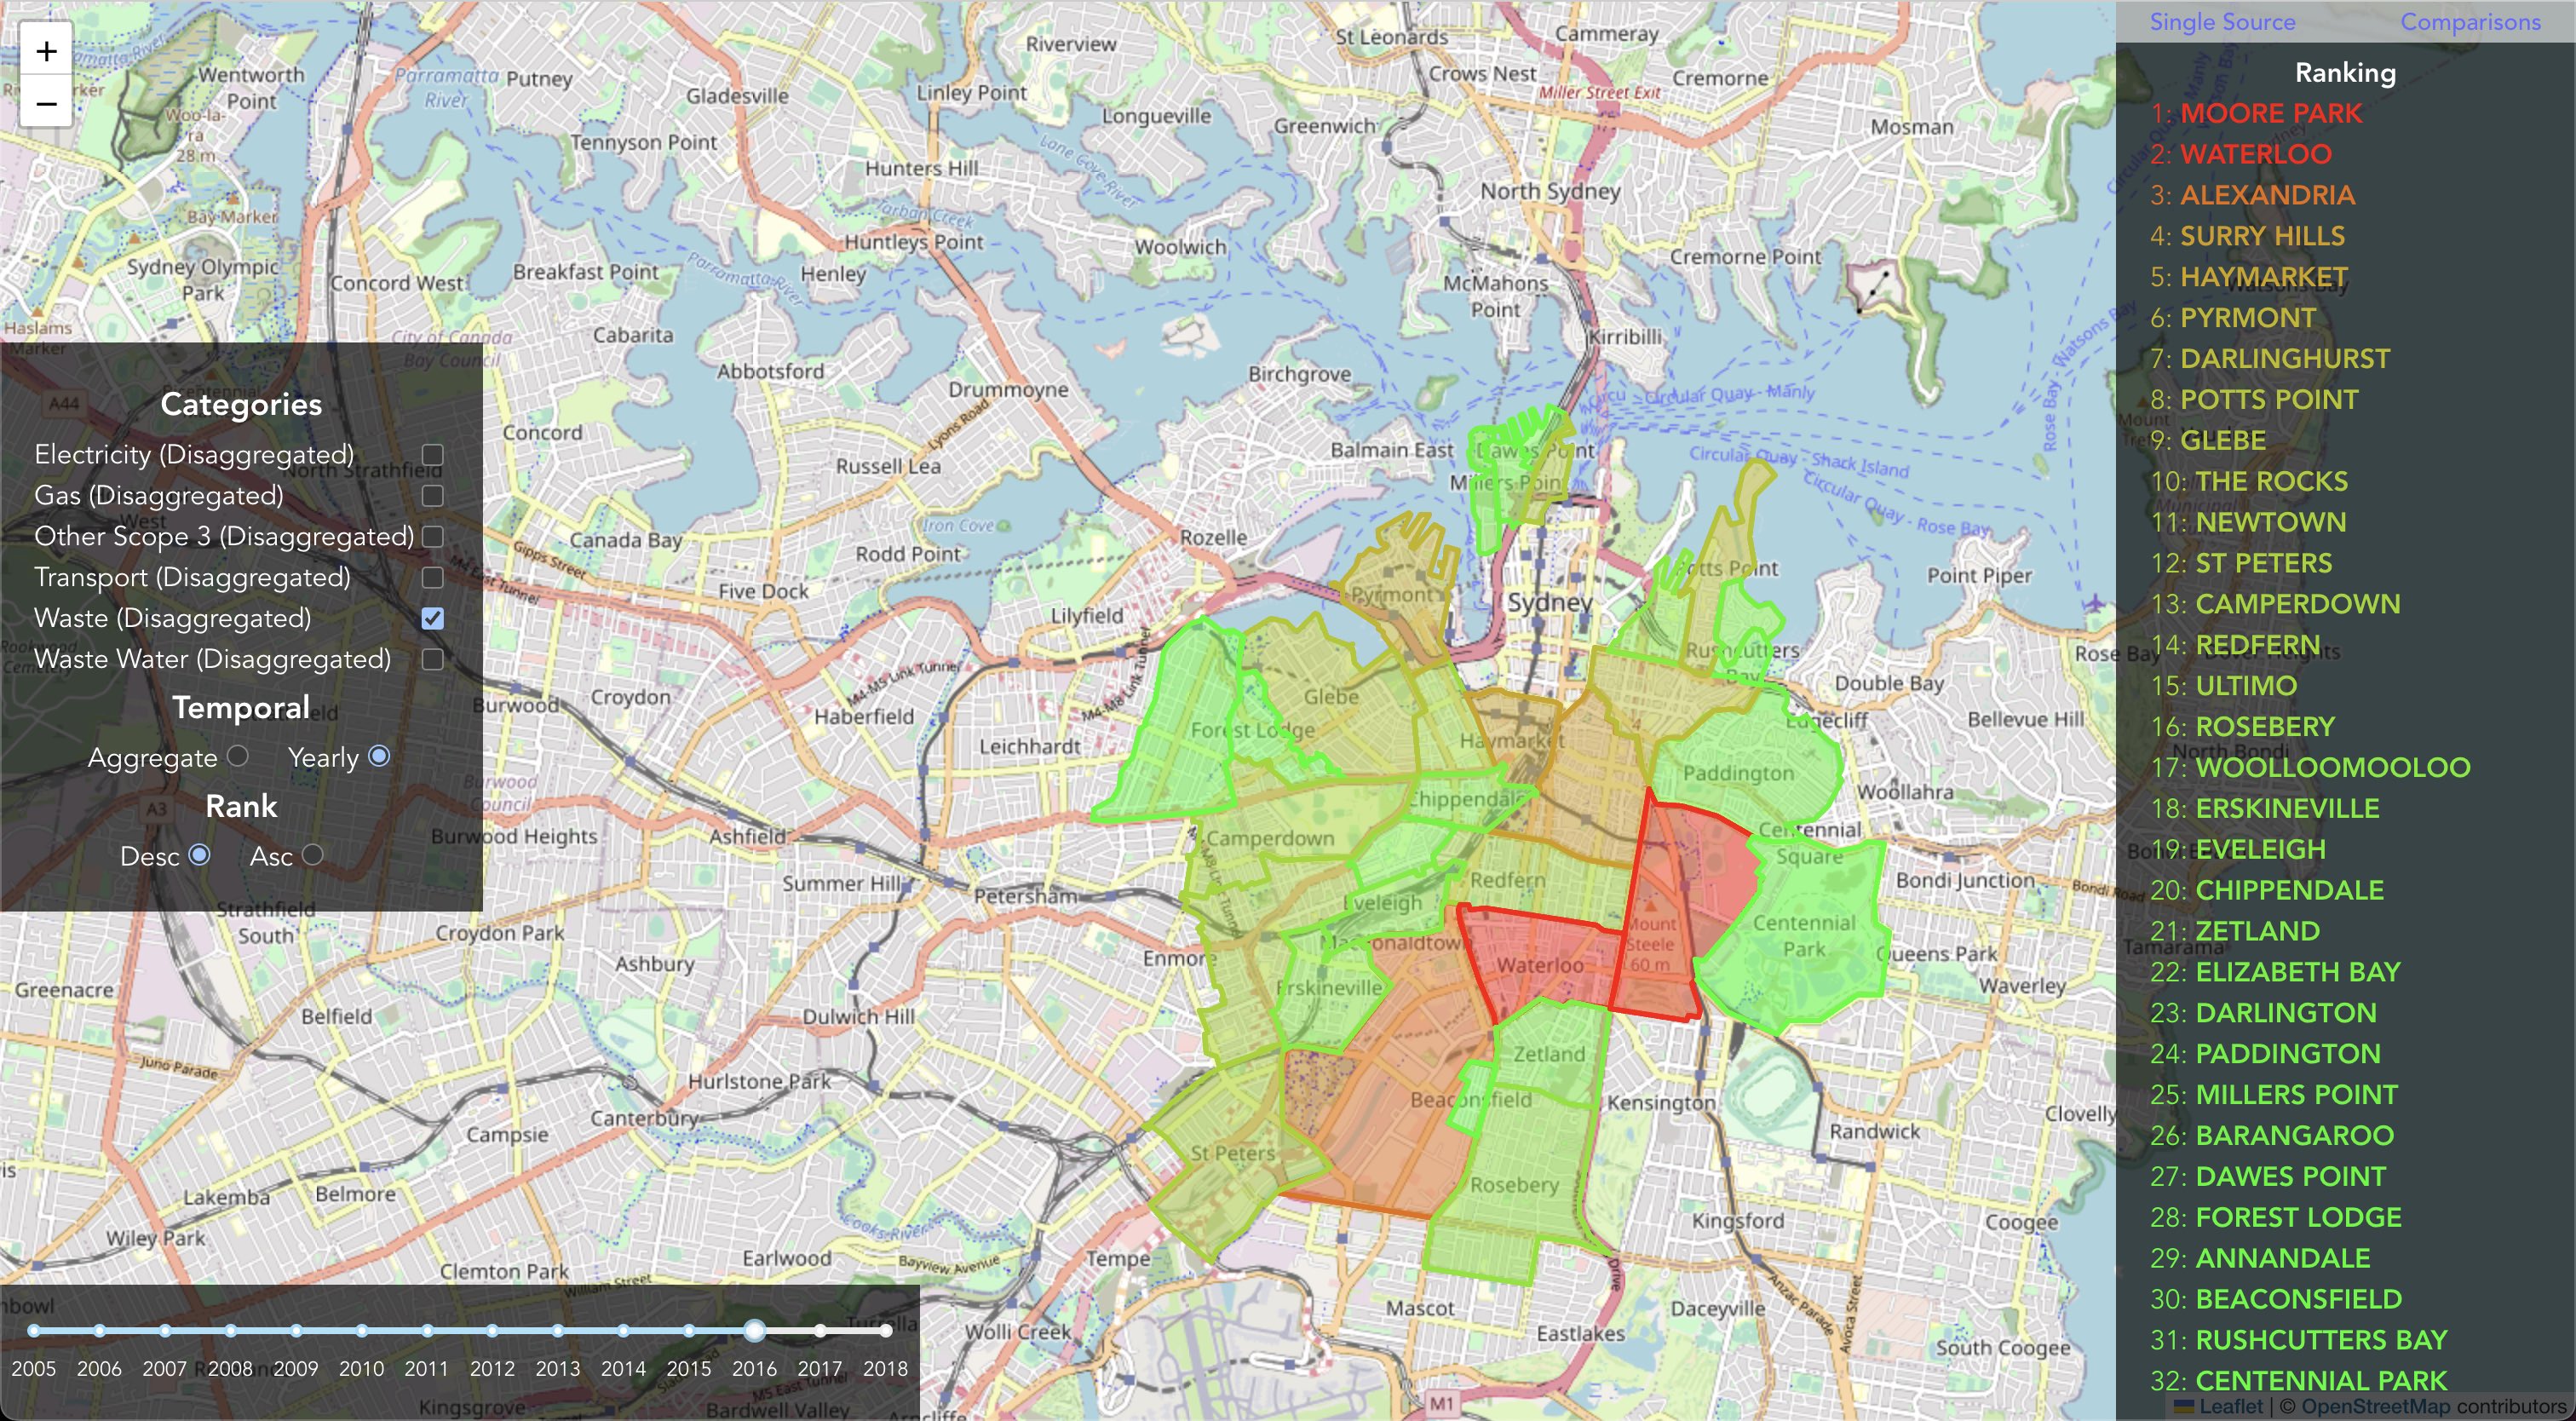
Single Source View
This view lets us look at a single source of data in detail. We can
- compare regions against each other
- toggle which attributes to display
- filter data for a particular year
Tech Stack
Data Management Engine
- node.js
- express
- docker
Analysis Enginge
- python
- flask
- docker
Database
- postgres
- postGIS
Viewer
- react
- leaflet